


Customer Birthday Discount
Custom Report Dashboards provide a way to see a variety of sales and pickups figures and graphs in one personalized view. They can be used to monitor a store’s sales to goal, daily donation pickups, etc.
This article reviews how to setup and view custom report dashboards.
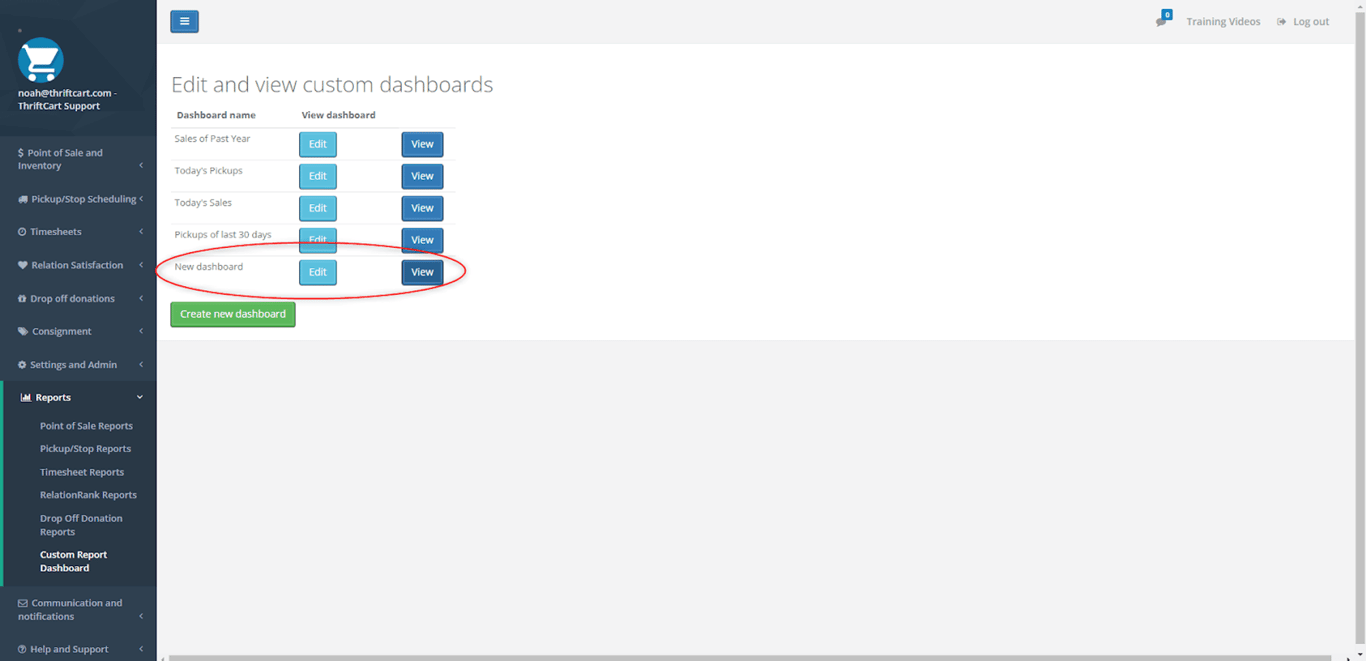
- You can find the Custom Report Dashboard by going to the left side navigation bar > Reports > Custom Report Dashboard.
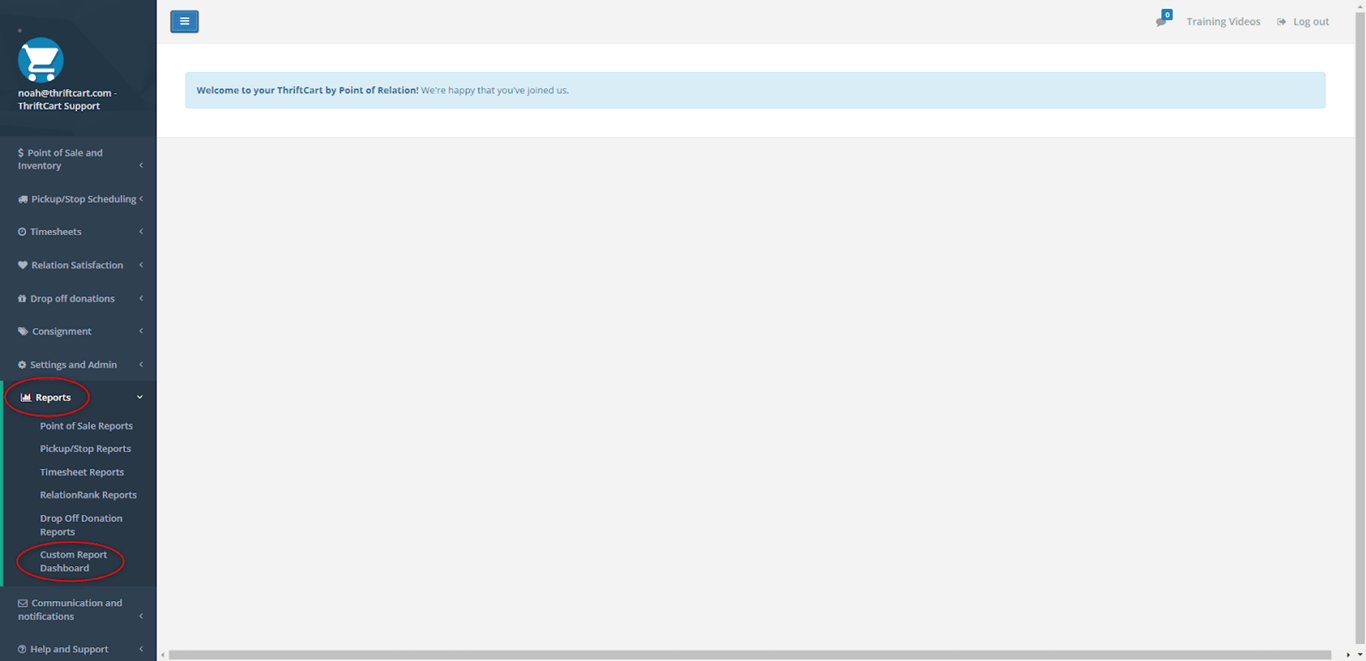
- On this page, you can view and edit any report dashboards that you have previously created, and create new dashboards.
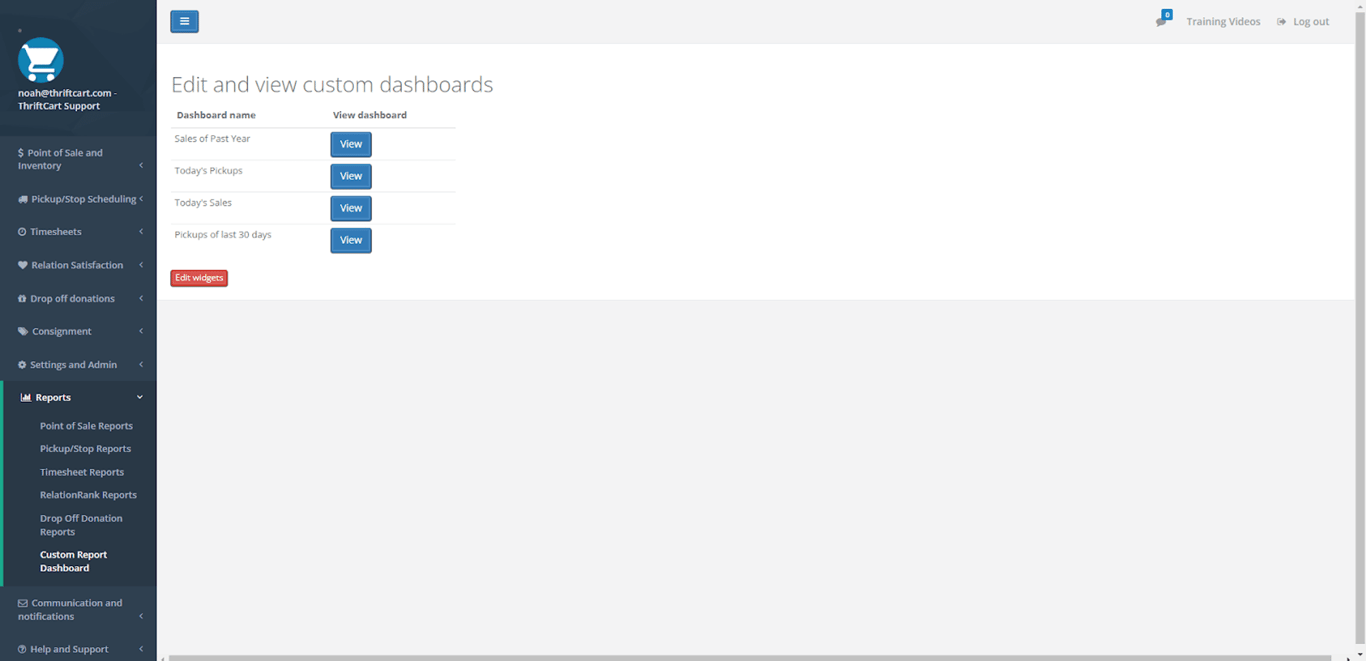
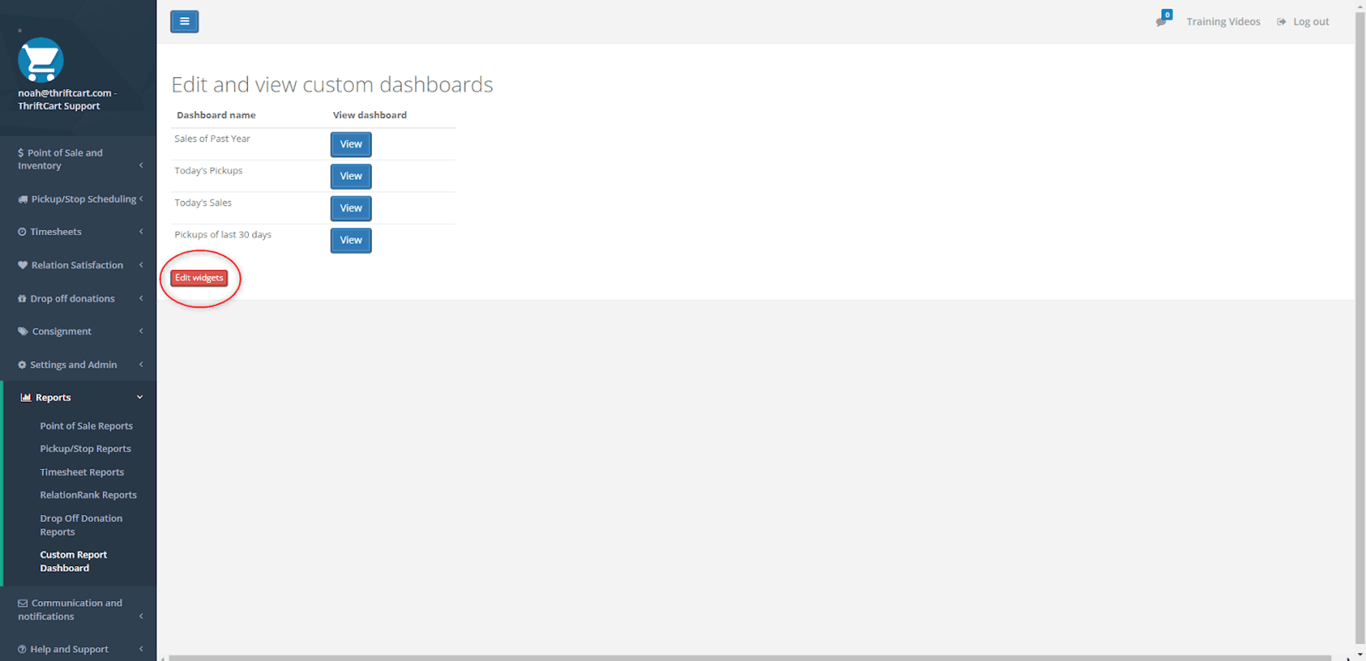
- To create a new dashboard, select the red Edit widgets button.
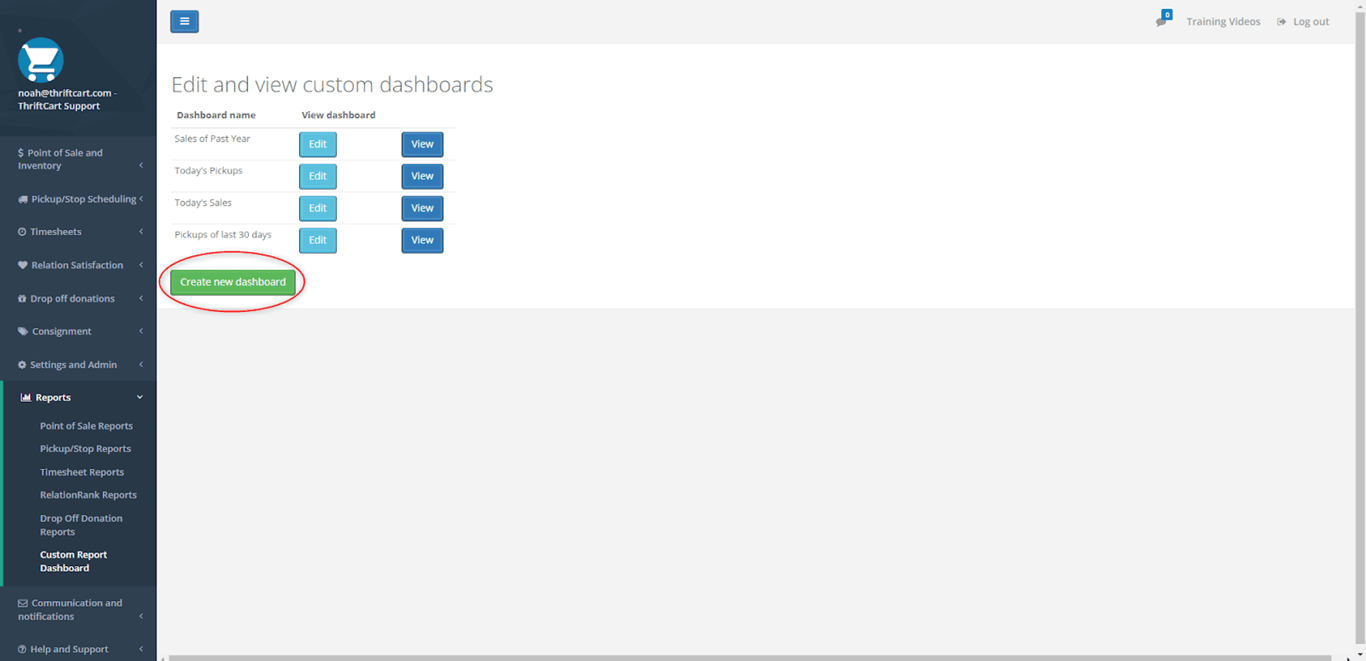
- Then, select the Create new dashboard button.
- Doing this will take you to the dashboard creation screen with a variety of options to customize the dashboard.
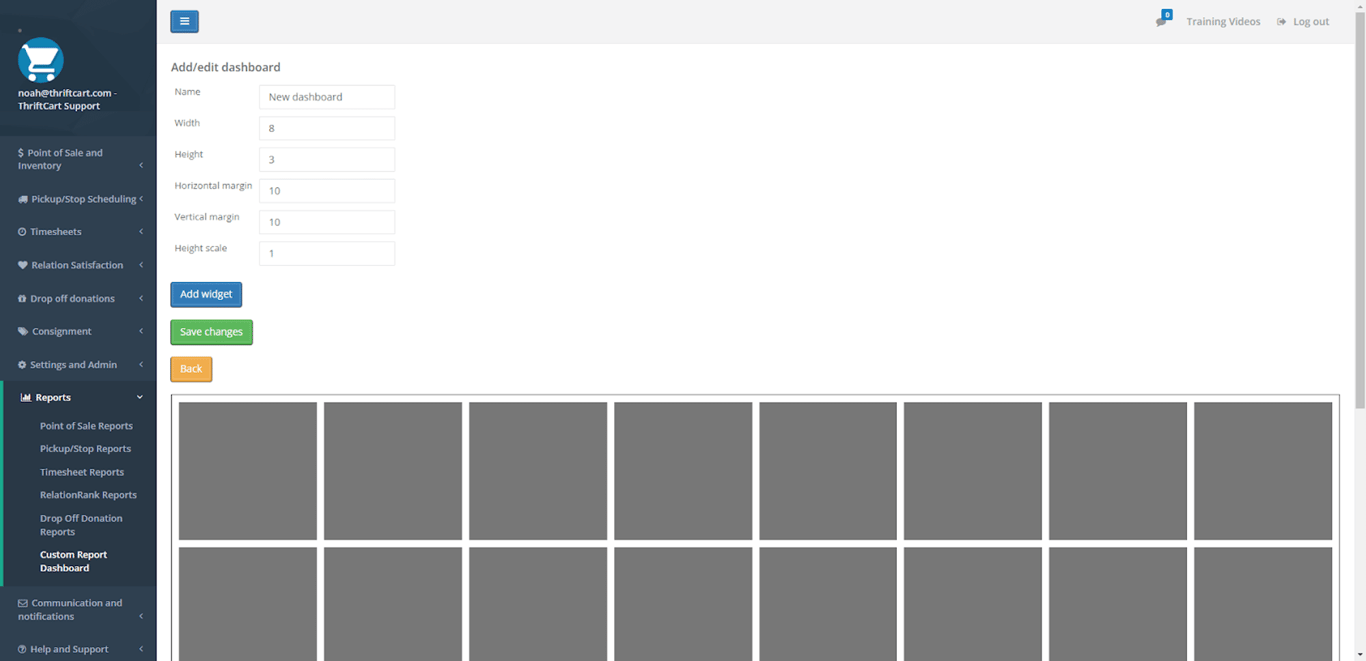
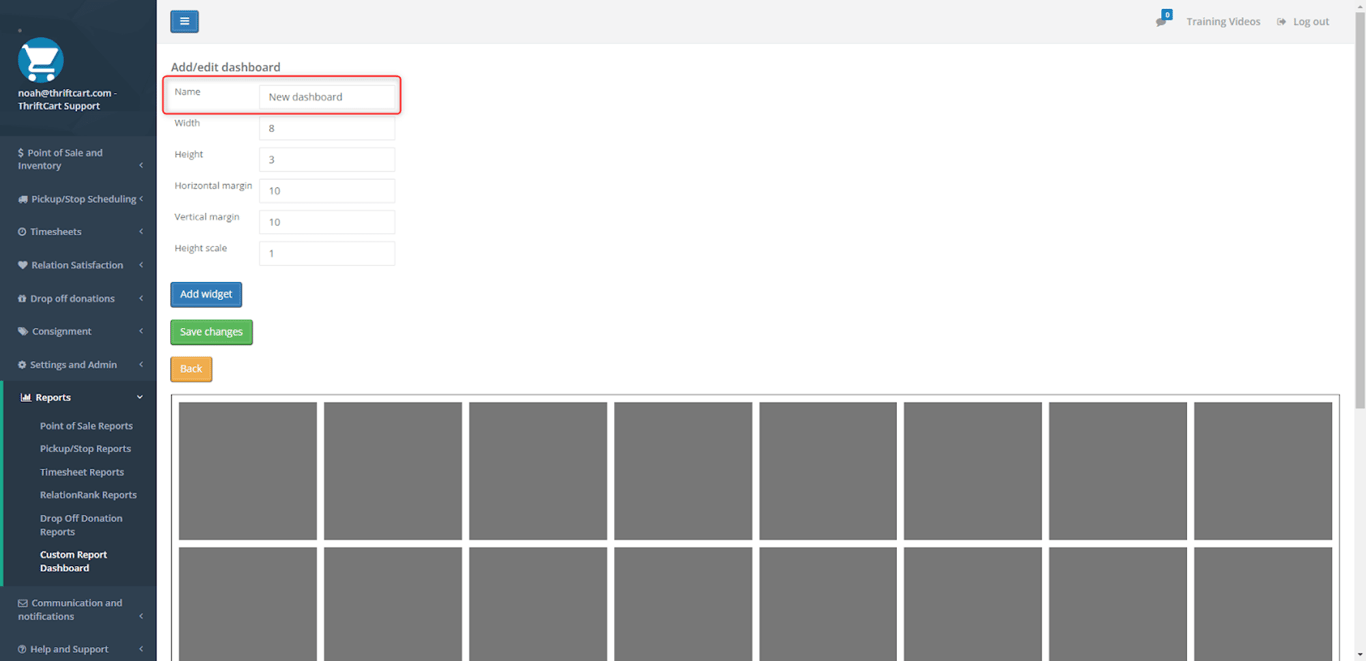
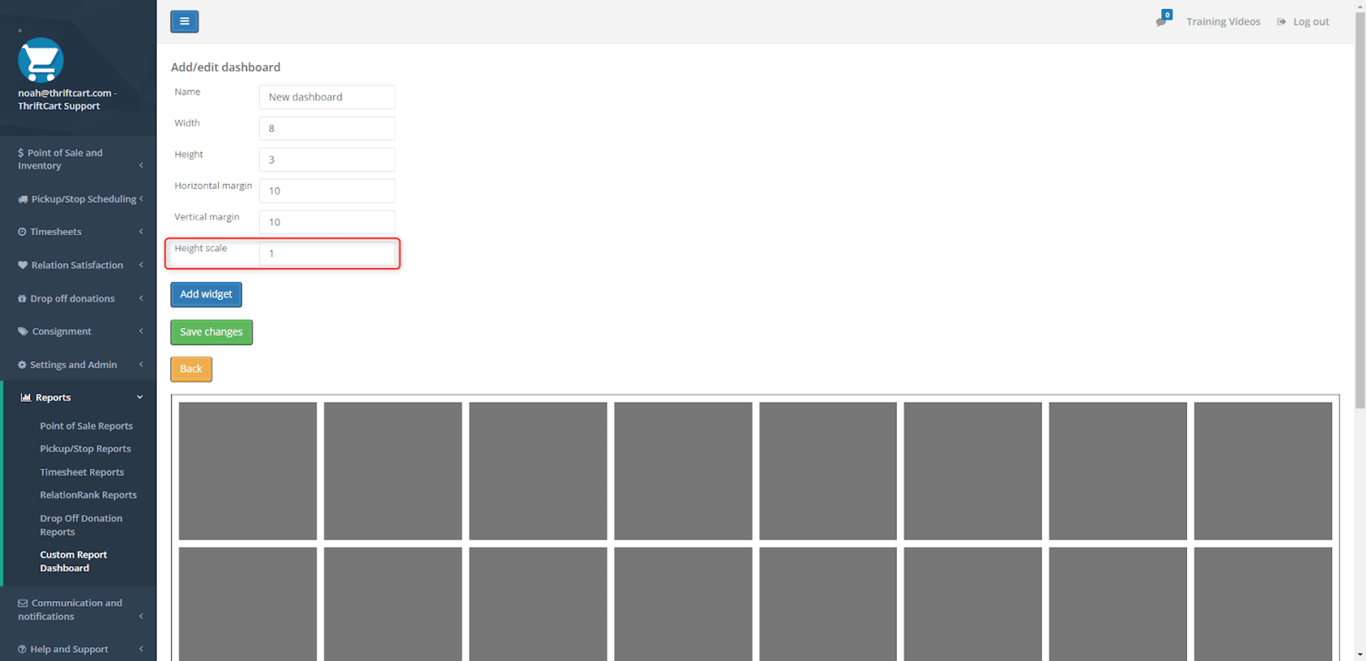
- First, you can change the name of the dashboard (e.g. sales dashboard or Joe’s dashboard).
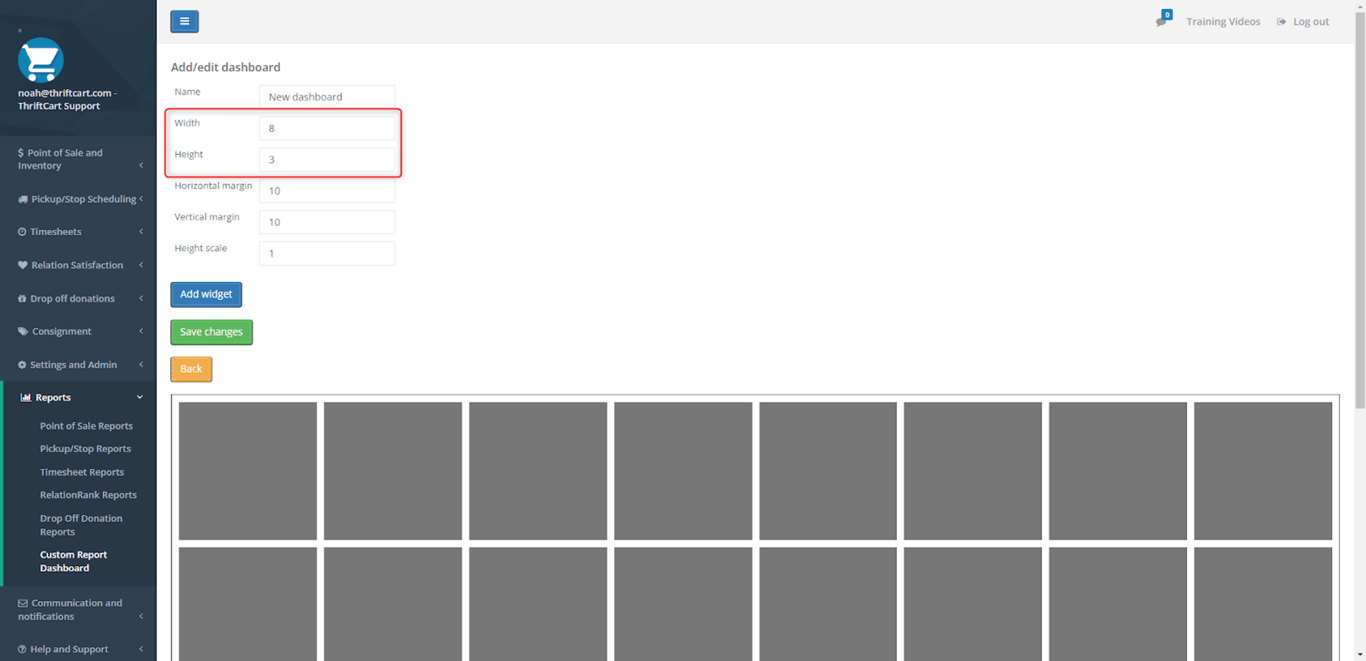
- The Width and Height fields will adjust the amount of boxes in rows and columns.
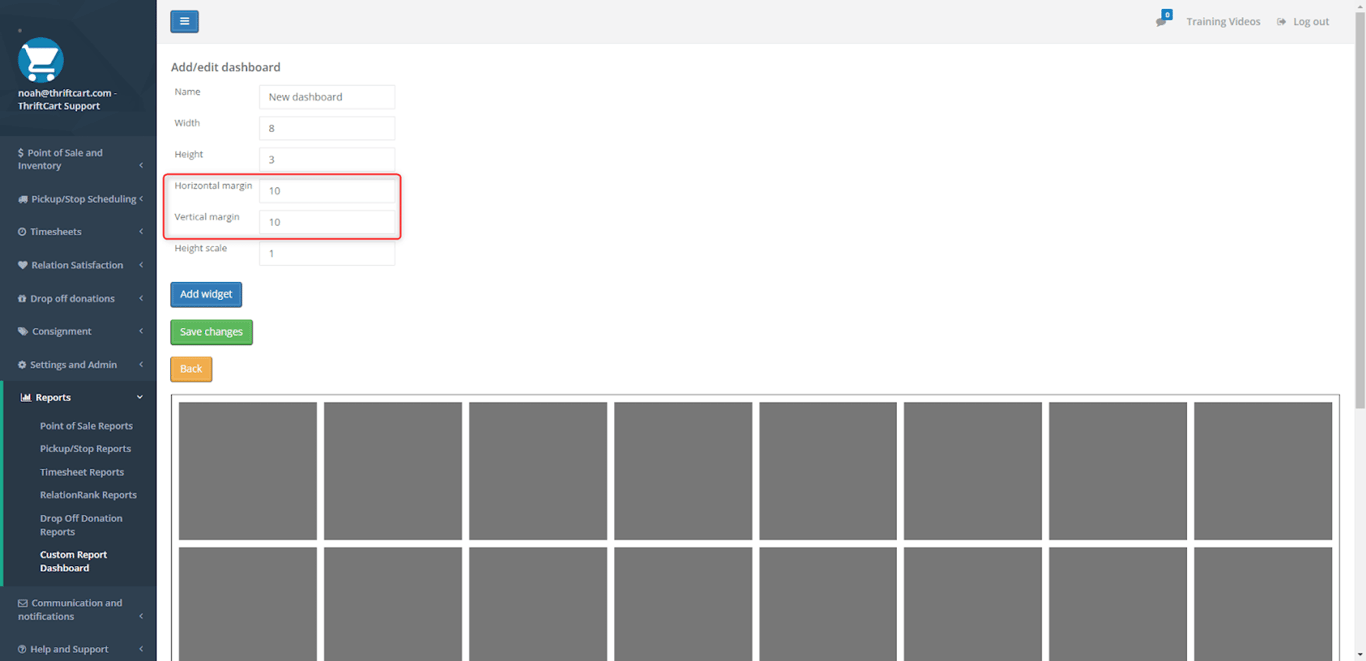
- The Horizontal margin and Vertical margin fields adjust the spacing between the boxes.
- The Height ratio field will adjust the vertical height of the boxes.
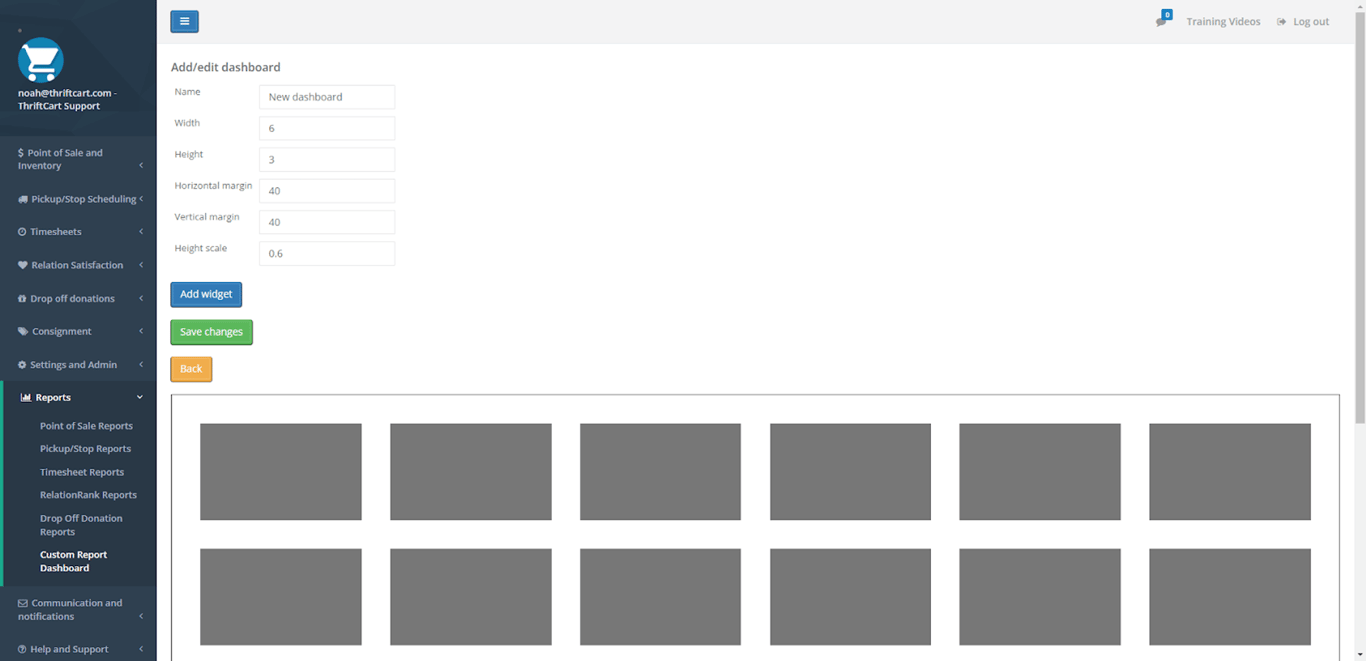
- With some slight adjustments, you can make your dashboard look something like this.
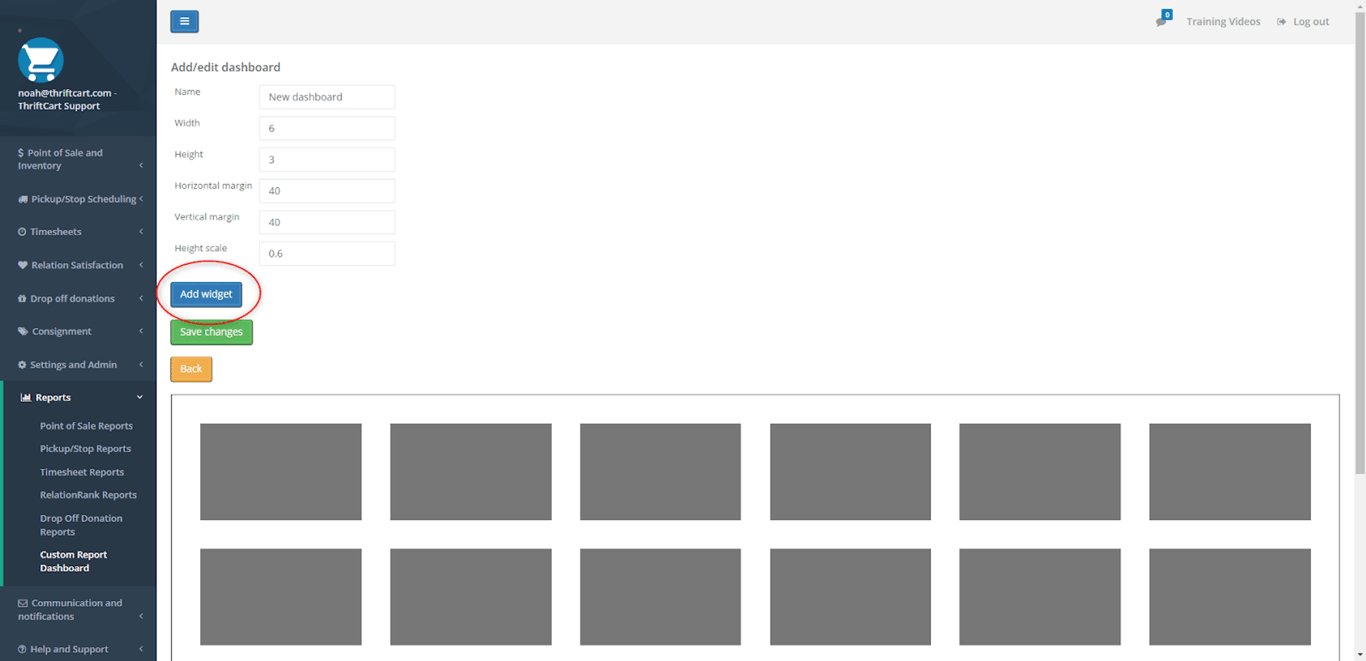
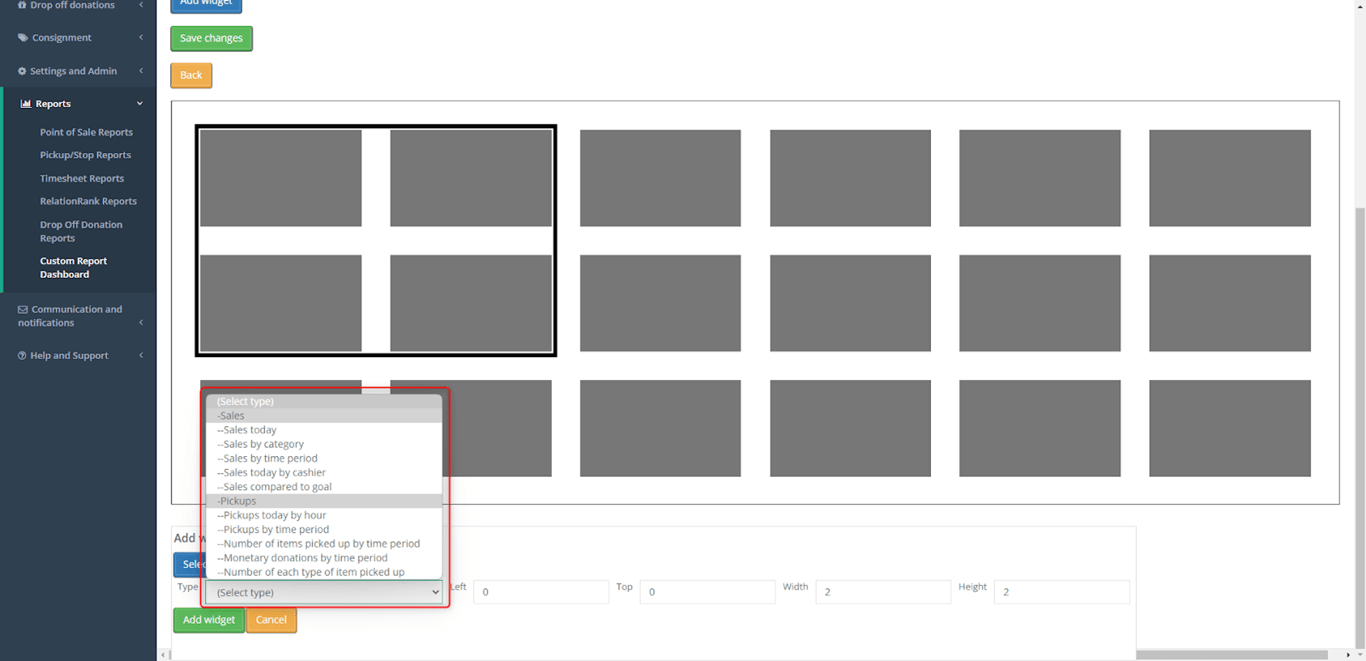
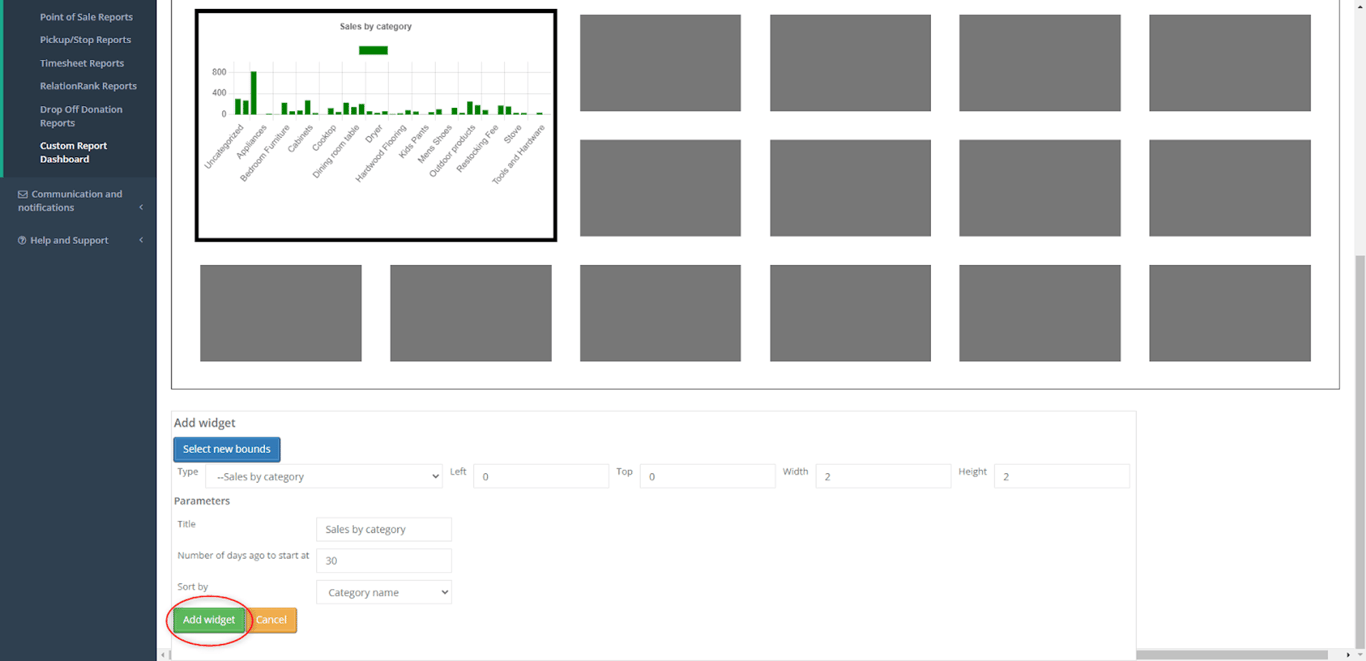
- Pressing the Add widget button will create a new data widget to display on the dashboard.
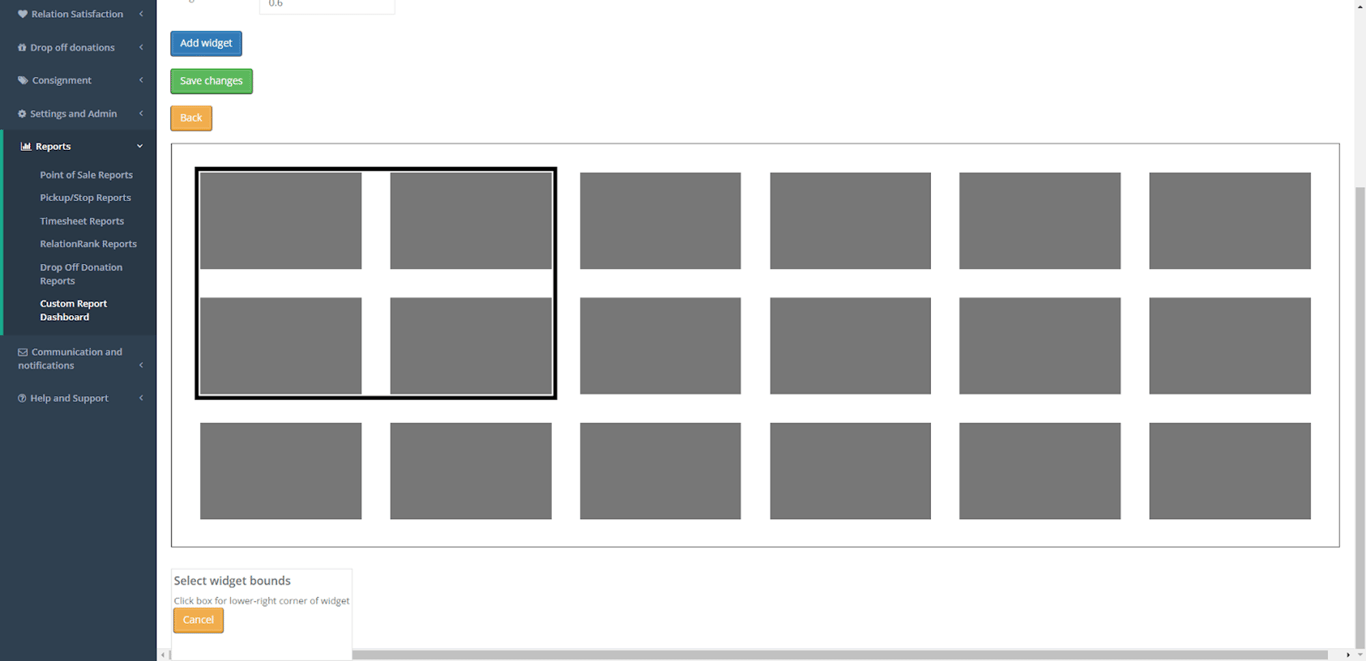
- To select the amount of space a widget should take up, click the first box you would like it to use and then drag and select the last box that you would like this widget to take up.
- After selecting the size for this widget, you will be provided with options to customize the widget. The drop-down next to the Type text box will provide you with the different type of data widgets you can enter into the dashboard. In this example, I will use the Sales by Category widget.
- After selecting the widget, you will see the data appear in the selected boxes.
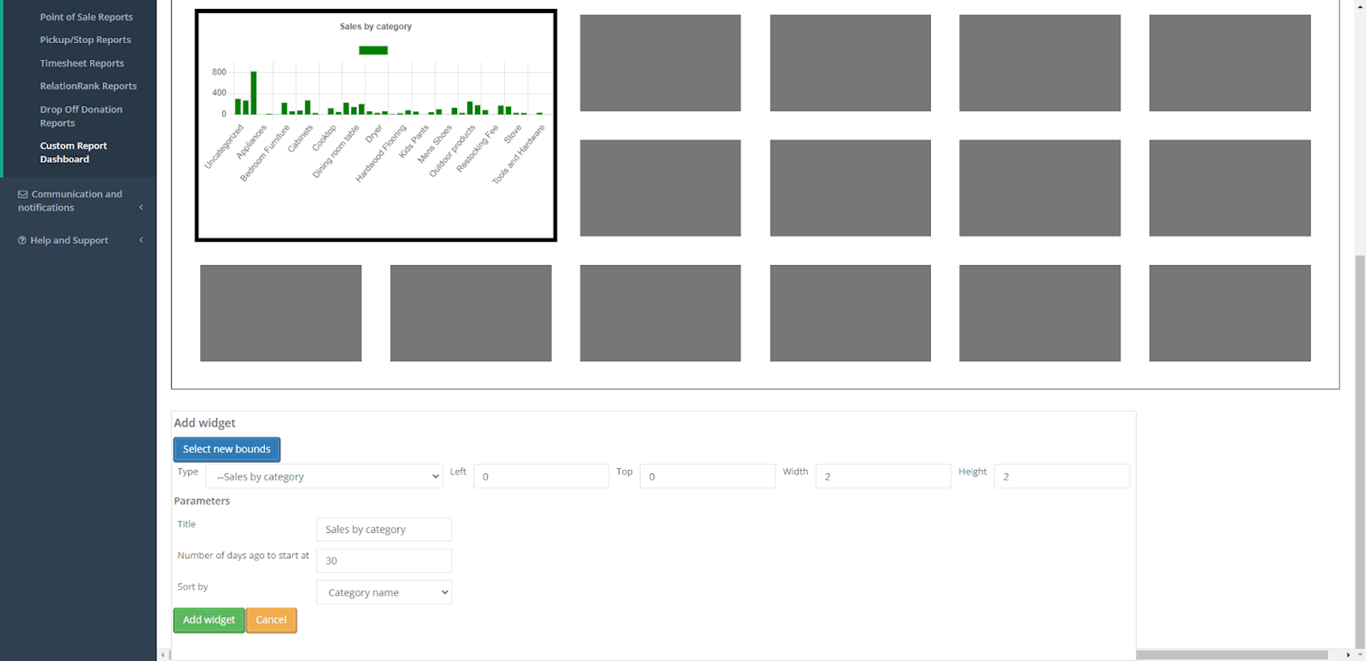
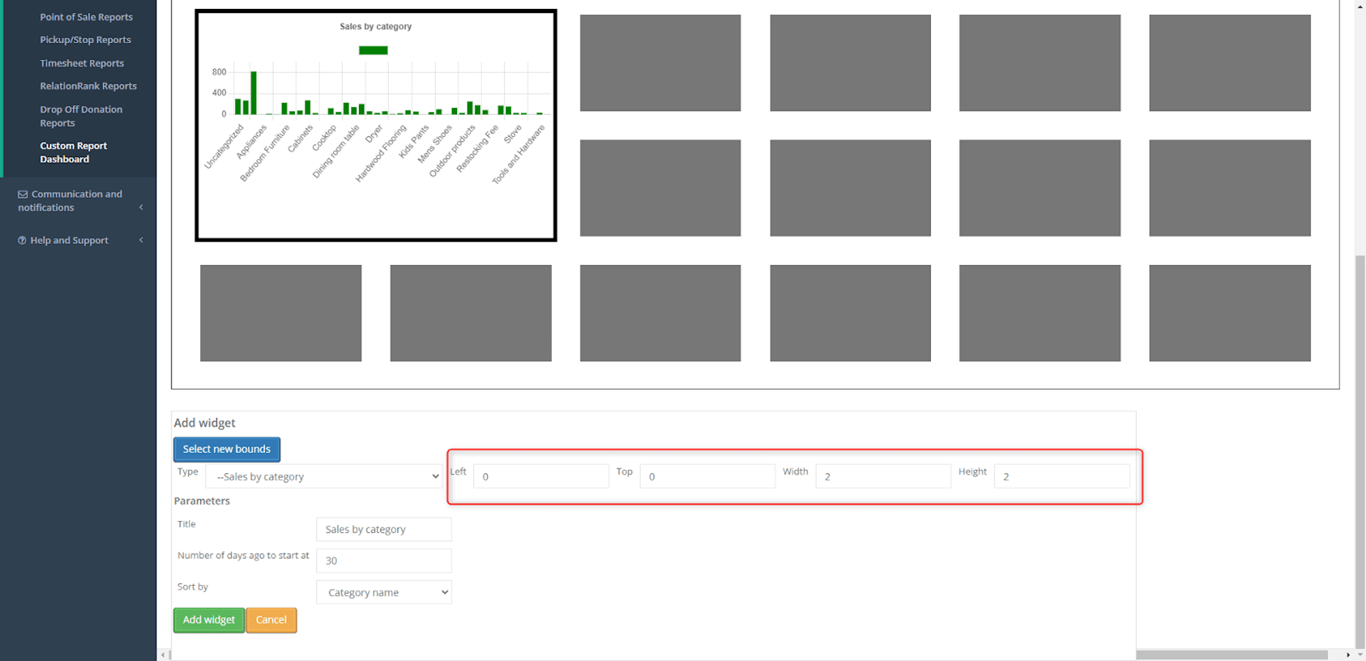
- There are further options for customization once you add in this widget. You can adjust the size and position of the widgets by using the four fields to the right of the widget type.
- Some widgets will also provide additional customization, such as editing the title, date range for the data, and sorting filters.
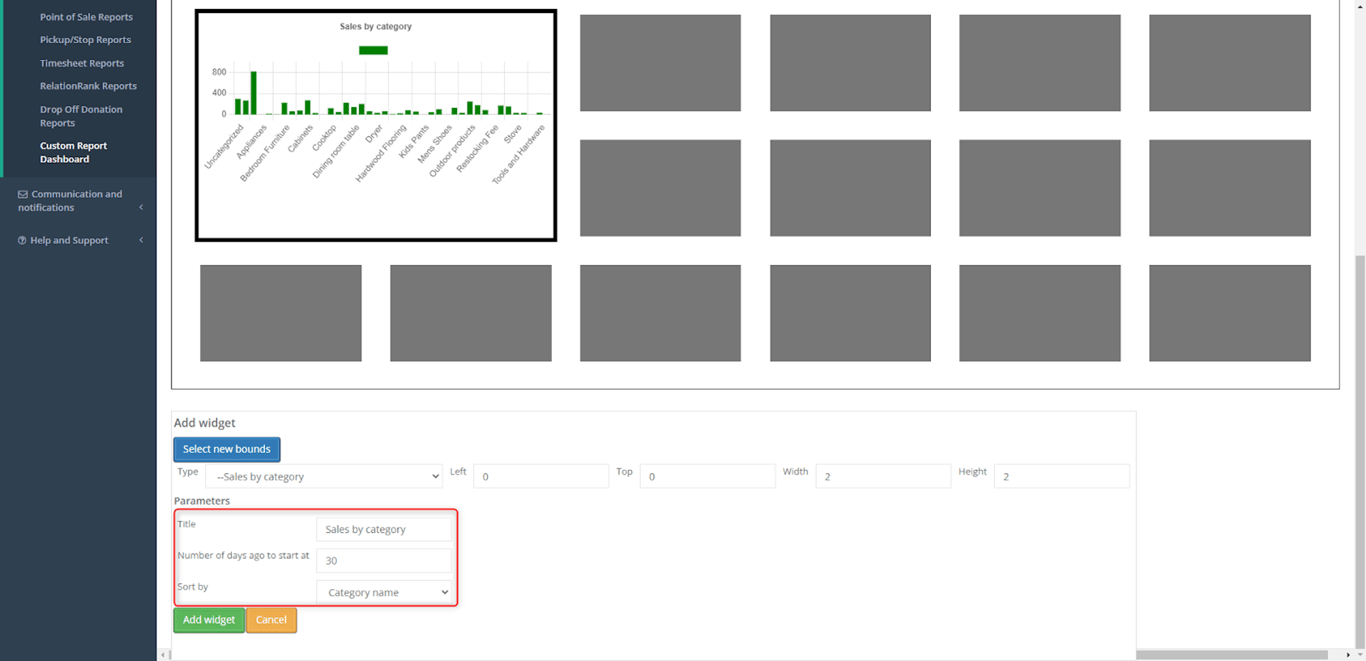
- Once you customize the widget to your liking, press the green Add widget button to finalize this widget on your dashboard.
- Once you have added all the widgets you desire, press the green Save changes button to complete this dashboard. Note: I added a variety of widgets to show a finished product of this dashboard.
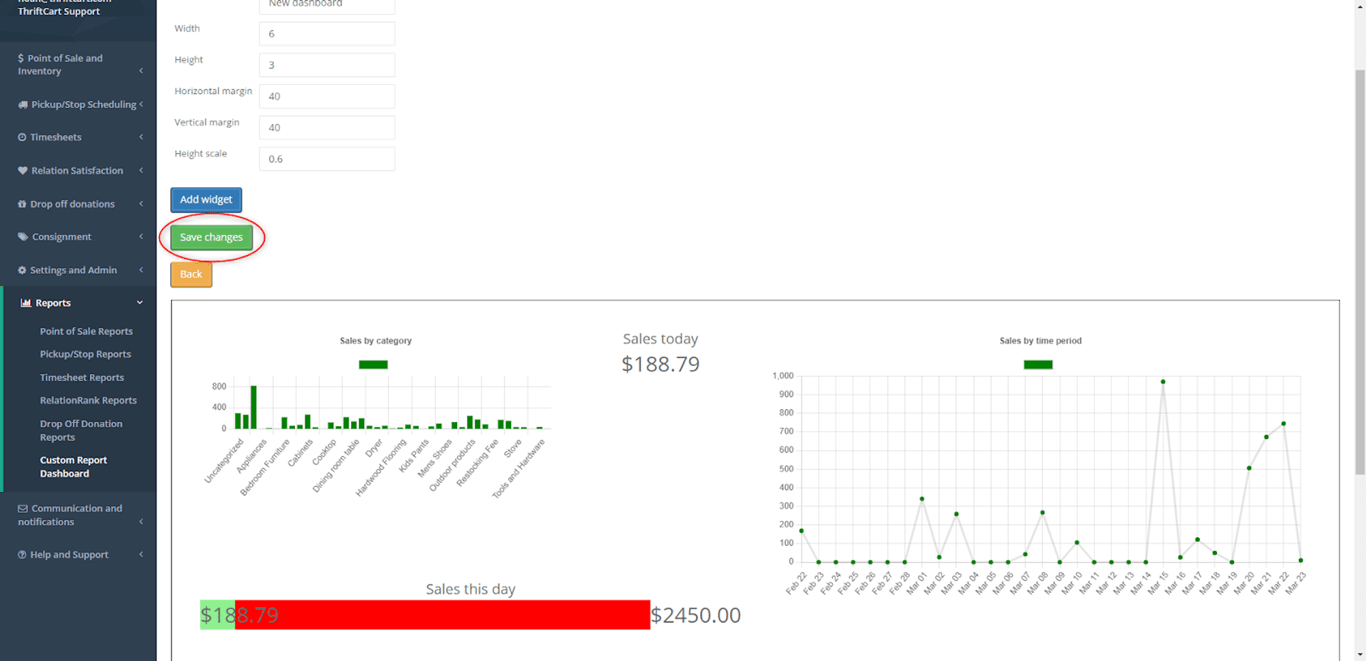
- This dashboard is now complete, and you can press the blue View button to open a new page that will display only this dashboard.
You have now completed a custom report dashboard in ThriftCart! Dashboard data updates in live-time, so there is no need to refresh the page to view new data!

With three years in the thrift industry during a pivotal shift to omnichannel selling, Kyle Payton helps stores better manage inventory and forecast product needs. As General Manager at ThriftCart, he focuses on equipping nonprofit thrift operations with point of sale technology that makes their day-to-day operations easier.
Kyle's passion lies in helping thrift store managers embrace digital solutions that support their unique mission and maximize their impact in the community.
"Supporting nonprofits is incredibly rewarding. I’m here to provide thrift store managers with the tools they need to thrive, so they can continue making a positive difference in their communities."